How to Value Backups in Fantasy Football

It’s a tricky calculation to figure out how to value backups. During an auction, how much of your budget do you allocate to backups? When drafting, which is more important: a backup quarterback, or a fourth WR? First, let’s take a step back. We need backups for four scenarios:

  1. To fill in during bye weeks
  2. As replacement if a starter is injured
  3. As replacement if a starter underperforms
  4. As replacement if the backup’s performance exceeds the starters

The first scenario is straightforward to calculate: if the backup has the same bye week as your starter it has 0 value to you. If the backup has a different bye week, it’s value is about 1/16 of his projected value. The other three scenarios require some probabilistic work, because we do not know if our starter will be out-performed by the backup or injured during the season.


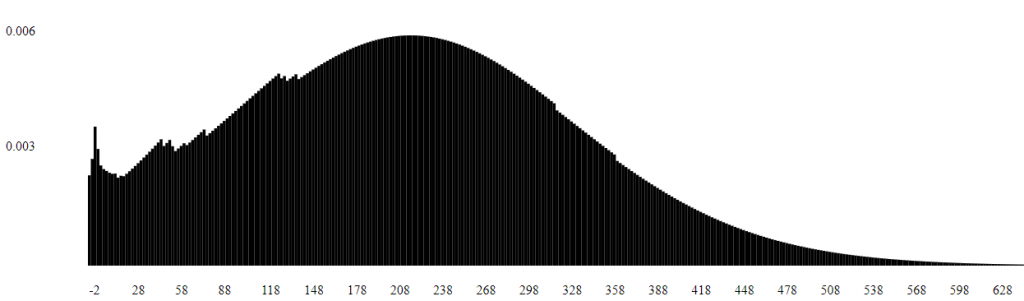
Above is a graph of expected points for Andrew Luck


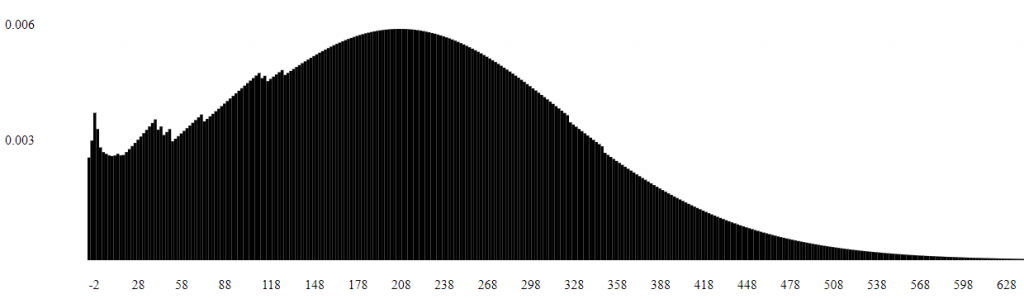
Marcus Mariotta’s graph is similar. Luck is projected to score about half a point per game more. There’s a lot of uncertainty in the projection, and to see that a heap of ‘idunno’ is probably justified for future-looking predictions, try predicting the future yourself at quncertain.com.

In the system, Luck is projected as the 8th best QB and Mariota is projected as around 14th best, but it’s conceivable for either to be vastly better than this ranking at the end of the year. There is also injury concern with Luck. So, some teams will no doubt have Luck as a starter and Mariota as a backup with breakout potential. Also, both players have different bye weeks.

So how do you value Mariota? He could be your starter by the end of the season. Or, Luck could reel off an MVP year, with Mariota riding the bench and contributing very little to your score. It depends on who plays better. Because you are able to adjust your rosters week to week, you’re able to swap in the player with the better chance of a big game. Looking at the expected points for a weekly max-type function with Luck+Mariota gives a graph like this:


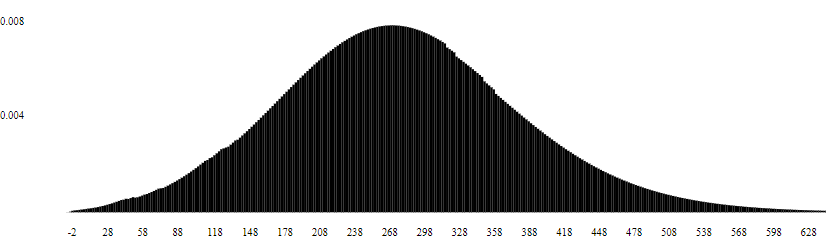
Expected points from a Luck, Mariota combination.

As you can see, backups are useful because they:

  1. Mitigate downside risk
  2. Increase the median of expected points

Adding a third backup is an improvement again, just not as dramatic. Adding Trevor Siemian as a third QB gives a graph like this:

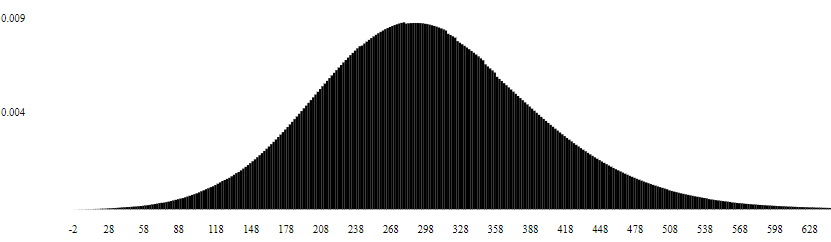
Expected points for Luck, Mariota, Siemian combination, truncating the left tail, elongating the right tail, and shifting the median a little to the right.


With data like this we can calculate the value of backups, directly relating price to the amount they increase a team’s chance of winning a league. Calculations for positions with multiple starters, and flex options are more complicated because of the many combinations to consider, but the results are approximately the same. I hope to have my auction valuations on the site soon.


2017 Fantasy Football Projections

Here are some projections for the upcoming fantasy football season. These projections were generated with a system looking at the following inputs:

Position

Point totals by week for the previous two seasons

Current position on the organization depth chart (as of July 22)

Age

As a guideline, if a projection seems off, and you reason it is due to factors not considered above (injuries, getting cut, etc), definitely use your gut. Otherwise, use your gut slightly less. For instance, the rookie running back class seems underestimated by this system, so I might try to add some additional signals. Although, the system does know that McCaffrey, Fournette, Dalvin Cook are listed at the top of the depth chart for their current teams, and that Dennis Pitta is not currently listed on any depth charts.

Click the names to view the distributions for each player. Auction values coming soon, and I will run results for several different scoring systems, probably dumping a bunch of them on rototheory.com.

These results are for a league I’m in, a PPR, 6points for QB touchdown, standard points for yards scoring system.


Name Mean Average Points

Drew Brees
242.7

Aaron Rodgers
239.2

Matt Ryan
236.6

Cam Newton
230.6

Tom Brady
224.4

Derek Carr
221.9

Eli Manning
221.4

Andrew Luck
219.8

Russell Wilson
219.5

Blake Bortles
219.3

Matthew Stafford
218.8

Philip Rivers
218.2

Kirk Cousins
218.1

Carson Palmer
217.6

Ben Roethlisberger
214.9

Marcus Mariota
211.6

Antonio Brown
211.5

Jameis Winston
211.3

Tyrod Taylor
208.4

Odell Beckham
207.9

David Johnson
207.7

Andy Dalton
206.9

Joe Flacco
203.6

Alex Smith
203.4

Ryan Tannehill
203.2

Julio Jones
200.5

Sam Bradford
200.2

Devonta Freeman
199.9

Click Here for the full table

Click to see the full table

2017 Projections Ranked

A rankings list is the most common way to make decisions during a fantasy baseball draft. Here is a stab at a rankings list based on the projection distributions I released previously. It is calculated for a 12 team yahoo standard league.


R RBI HR SB AVG W SO SV ERA WHIP total

Mookie Betts
11.8 11.2 10.0 21.9 9.8 53.8

Jose Altuve
11.3 10.0 8.6 25.9 10.4 53.2

Mike Trout
11.8 10.4 12.2 23.0 4.7 50.7

Max Scherzer
18.0 20.0 2.5 7.1 10.2 47.8

Paul Goldschmidt
10.9 9.6 10.8 23.0 3.7 46.5

Charlie Blackmon
10.5 9.6 9.1 18.6 7.9 46.4

Jean Segura
10.2 8.1 6.7 26.4 7.9 46.2

If you use this list, please note it hasn’t been updated for injuries, or playing time. Especially with closers, consult some other sources to make sure a closer has his job before drafting him. I noticed several players are commonly drafted following this system. Jean Segura, Brian Dozier, Jonathan Villar, Rick Porcello, Eduardo Nunez, AJ Happ, and Rajai Davis are players I’m getting in almost every mock draft I do. Other systems expect these players to regress to the mean more than my projection system, so you might discount them a lot or a little when drafting.


For Segura, he will now play half his games in Seattle, instead of Arizona. The other players just had breakout years. The possibility (even, the likelihood), of regression has definitely been factored in to the projection distributions. If you click on any of these names, you’ll see there are many possible outcomes where Segura regresses.


The total score isn’t an auction value. And, this system does not account for position scarcities. It’s designed as a rough tool to help you navigate a round robin, 12 team fantasy baseball draft. I hope it works for you.


Click For Full Rankings Table

Click to see the full table